A vendor tells you their IP block is “ASIL-B ready.” What should land in your inbox when you ask them to prove it? This post walks through a complete FMEDA work package section by section — what each part is for, the arithmetic behind the headline metrics, and, most importantly, the assumptions that decide whether any of it means anything. If you are scoping a safety program and trying to work out what to demand from an IP supplier, this is the checklist.
There is a particular silence that follows asking an IP vendor for their FMEDA. Sometimes what comes back is a hundred-page spreadsheet. Sometimes it is a single slide with two percentages on it. Both can be labelled “ASIL-B.” Only one of them is going to survive contact with your safety assessor.
The difficulty is that FMEDA — Failure Modes, Effects and Diagnostic Analysis — names both a method and a deliverable, and the standard is much clearer about the first than the second. ISO 26262 tells you what quantities must be computed and what they must be compared against. It does not hand you a template for the document. So the quality of what arrives varies enormously, and a buyer needs to know what a complete one looks like.
1. What an FMEDA is, and what it is not
An FMEDA answers one question: when a transistor in this block fails, what happens, and would anything notice?
It is a quantitative argument about random hardware faults — the ones that arrive from physics rather than from a mistake. A cosmic ray flips a flip-flop. An interconnect via opens after ten years of thermal cycling. These are statistical, and they are what the metrics in ISO 26262 part 5 are about.
It is emphatically not an argument about systematic faults — a misread specification, a bad state machine, a testbench that shares its author’s misconception with the design. No amount of diagnostic coverage saves you from a design that was wrong on the day it was written. Systematic faults are addressed by process, review, verification independence and formal methods. If a vendor answers a question about verification quality by pointing at their SPFM number, they have answered a different question than the one you asked.
Both matter. They are separate work products and should be assessed separately.
2. The anatomy of a complete FMEDA report
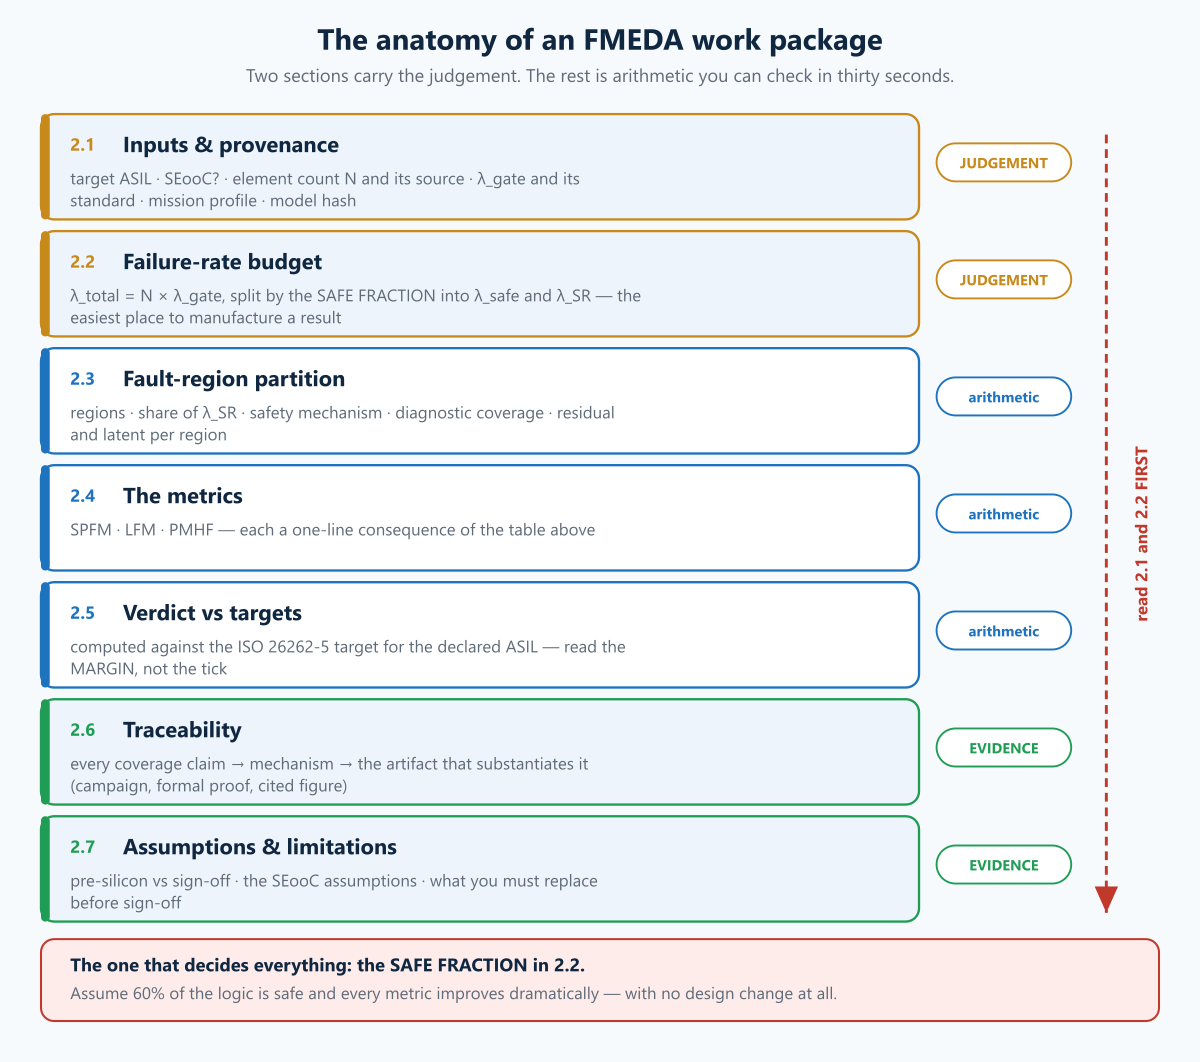
Here is the structure a work package should have, using an ASIL-B CAN FD controller as the running example.
The figures below are a representative worked example: the methodology and the provenance are exactly what we use, and every number is internally consistent so you can follow the arithmetic end to end, but the block is illustrative rather than a specific part. That is deliberate. Real per-IP metrics move whenever a fault campaign is re-run — quoting a shipping block’s numbers in prose guarantees that this page and that block’s own datasheet eventually disagree, which is a failure mode worth avoiding in an article about rigour. The live figures for any block we ship are on its catalog page, regenerated from the model rather than typed.
2.1 Inputs and provenance
Everything downstream is arithmetic. This section is where the judgement lives, which makes it the section worth reading first and the one most often thinnest.
It must state, at minimum:
- Target ASIL and whether the block is analysed as an SEooC (safety element out of context) — meaning the vendor assumed a usage context rather than knowing yours.
- Element count (N) — and where it came from. “27,348 cells, from the synthesis netlist cell report” is checkable. “approximately 30k gates” is not.
- Per-element failure rate () and its source standard. In our example: 0.02511 FIT per element, from SN 29500-2:2010 for permanent faults, pro-rated against a stated mission profile, plus a JESD89A term for single-event upsets using public soft-error-rate figures.
- The mission profile — operating hours per year, temperature distribution, lifetime. A failure rate without a mission profile is not a number, it is a mood.
- A hash or version of the model file, so the report can be tied to the exact inputs that produced it.
FIT = Failures In Time = one failure per device-hours. It is the working currency of the whole analysis.
The single most important thing here is the soft-error term. Public SER figures are generic; the real number depends on the foundry, the cell library and the altitude at which the part operates. A vendor who substitutes public figures should say so and tell you to replace them with the foundry’s measured SER before sign-off. One who quietly presents generic SER as final is either careless or hoping you will not check.
2.2 The failure-rate budget
Now the arithmetic starts. Total failure rate is element count times per-element rate:
= N × = 27,348 × 0.02511 = 686.7 FIT
Then it splits. Not every fault can hurt you — a fault in logic whose output can never propagate to a safety-relevant outcome is safe by construction. That fraction has to be declared and justified:
- safe fraction = 0.25
- = 0.25 × 686.7 = 171.7 FIT
- = 0.75 × 686.7 = 515 FIT ← the safety-related budget everything is measured against
Watch this number. The safe fraction is the easiest place in an entire FMEDA to manufacture a good result. Assume 60% of your logic is safe and your metrics improve dramatically without a single design change. A defensible FMEDA justifies the safe fraction structurally; an indefensible one asserts it. If you read one line of a vendor’s FMEDA, read this one.
2.3 The fault-region partition
The block is divided into regions that fail in genuinely different ways and are protected by genuinely different mechanisms. This is where design knowledge enters the analysis, and a partition that mirrors the actual architecture is a strong signal the analysis was done by someone who knew the block.
| # | Region | Share | λᵢ (FIT) | Mechanism | SPF DC | Residual ,ᵢ | Latent DC | ,ᵢ |
|---|---|---|---|---|---|---|---|---|
| 1 | Config registers | 0.200 | 103 | parity | 90.00% | 10.3 | 90.00% | 9.271 |
| 2 | Control / bit-timing FSM | 0.150 | 77.25 | lockstep | 95.00% | 3.863 | 90.00% | 7.339 |
| 3 | RX id/ctrl metadata | 0.150 | 77.25 | SECDED | 99.00% | 0.7725 | 90.00% | 7.648 |
| 4 | 64-byte RX payload | 0.300 | 154.5 | SECDED + CRC | 99.00% | 1.545 | 90.00% | 15.3 |
| 5 | CRC / bus-off / bit-stuffing | 0.200 | 103 | protocol | 95.00% | 5.15 | 90.00% | 9.786 |
| Total | 1.000 | 515 | 21.63 | 49.34 |
Read it left to right. Each region carries a share of the safety-related budget. Each has a safety mechanism — the thing that would notice a fault. Each mechanism has a diagnostic coverage (DC): the fraction of faults in that region it actually catches. What the mechanism fails to catch is residual — the part that reaches the output unannounced.
Note that the coverage figures are not uniform, and they should not be. Parity on a config register catches single-bit corruption but not a coherent multi-bit failure, so 90% is honest. SECDED on a payload does better. Lockstep on a state machine does better still. A report where every region is coincidentally 99% covered was written by someone filling in a column, not analysing a design.
Two arithmetic checks you can run yourself in thirty seconds:
- Shares sum to 1.000. The example’s do.
- Residual . Region 1: 103 × 0.10 = 10.3 ✓.
If either fails, stop reading and ask why.
2.4 The metrics
Three numbers come out, and each answers a different question. Before the formulas, the picture — every fault in the block lands in exactly one of these buckets, and each metric is a ratio between two of them:
SPFM — Single-Point Fault Metric.Of the faults that matter, what fraction is covered by some mechanism? It is the headline robustness figure.
LFM — Latent Fault Metric.Of the faults that slip past, how many could sit there silently and combine with a second fault later? This is the one people forget. A dormant failure in a safety mechanism is invisible until the day it is needed.
The term is the wholly undiagnosed single-point faults — regions with no safety mechanism at all. It is zero in this example because every region has one, which is why the denominator collapses to − Σλ_RF. It is not zero in most real designs, and dropping it inflates LFM. If a vendor’s LFM denominator is just − , check that every region genuinely has a mechanism.
PMHF — Probabilistic Metric for random Hardware Failures. The absolute one: what is the hourly probability this block causes a hazard? Expressed per hour, and the only metric with a physical rather than proportional meaning.
Read that label carefully, because this is where PMHF figures are most often quietly flattering. What is computed above is the residual contribution only. A complete PMHF per part 5 adds a dual-point term — the probability that a latent fault is sitting undetected when a second fault arrives — weighted by the exposure time and the multiple-point fault detection interval, which is usually the diagnostic test interval or the power-on self-test period. That term can be small, and for many blocks it is; but it is never automatically zero, and a residual-only figure will always look better than a complete one.
So a residual-only PMHF is a perfectly legitimate pre-silicon number — provided it says that is what it is. “Is this PMHF residual-only, and if so where is the dual-point term?” is the single best PMHF question to put to a vendor.
2.5 The verdict
Metrics are meaningless without their targets. ISO 26262 part 5 sets these by ASIL, and the report should show the comparison explicitly rather than leaving you to look them up:
| Metric | Computed | ASIL-B target | Margin | Pass |
|---|---|---|---|---|
| SPFM | 95.80% | ≥ 90% | +5.8 pts | ✓ |
| LFM | 90.00% | ≥ 60% | +30.0 pts | ✓ |
| PMHF | 2.16 × 10⁻⁸ /h | < 10⁻⁷ /h | 5× under | ✓ |
Margin is the interesting column. A block that clears ASIL-B by a tenth of a point is one netlist revision away from failing, and integration will move these numbers. Margin is what tells you whether the result is robust or merely true today.
The targets tighten sharply with ASIL, and it is worth having the whole ladder in front of you rather than the one row that concerns you today — ISO 26262 part 5, Tables 4, 5 and 6:
| ASIL | SPFM | LFM | PMHF |
|---|---|---|---|
| A | not required | not required | not required |
| B | ≥ 90% | ≥ 60% | < 10⁻⁷ /h |
| C | ≥ 97% | ≥ 80% | < 10⁻⁷ /h |
| D | ≥ 99% | ≥ 90% | < 10⁻⁸ /h |
Two things to read out of that table. ASIL-A has no quantitative hardware-metric targets at all — a vendor volunteering SPFM and LFM figures “for ASIL-A” is telling you something about how well they know the standard. And the step from C to D is where the difficulty lives: 97% to 99% SPFM is not a two-point improvement, it is a three-fold cut in residual failure rate, and the PMHF target tightens by a decade at the same time. A block comfortably passing ASIL-B may be nowhere near ASIL-D, and “we’ll lift it later” is a design change, not a paperwork change.
2.6 Traceability
The section that separates an analysis from an assertion. Every diagnostic-coverage number in that table is a claim, and each one needs a thread running from the claim to the artifact that substantiates it: region → mechanism → coverage value → the evidence.
Evidence means fault-injection campaign results, formal proofs of the mechanism’s detection property, or a cited industry figure for a standard structure. “Engineering judgement” is acceptable occasionally and damning as a pattern.
This is what an assessor will pull on, so it is what you should pull on first.
2.7 Assumptions and limitations
The final section, and the one that determines what the rest is worth. It must state plainly:
- This is a pre-silicon, engineering-grade analysis, not a sign-off. Nobody can produce sign-off numbers from a netlist and a standard’s failure-rate tables.
- The SEooC assumptions — everything the vendor assumed about your system in order to analyse a block they cannot see in context.
- What must be replaced before sign-off — foundry-measured SER, the real mission profile, the integrated rather than standalone netlist.
A vendor who writes this section clearly is telling you where the edges are. Its absence is not an absence of limitations; it is an absence of disclosure.
3. Auditing a vendor’s FMEDA: the short version
If you have twenty minutes and a PDF, in this order:
- Find the safe fraction. Is it justified or asserted? Easiest place to hide a good result.
- Check the shares sum to 1.0 and spot-check one residual as λ × (1 − DC).
- Look at the coverage spread. Uniformly high figures across dissimilar regions mean a filled-in column.
- Read the margins, not the pass/fail. Thin margins will not survive integration.
- Pull one coverage number’s traceability to its evidence. Follow it all the way down.
- Ask whether the PMHF is residual-only. If the report does not say, assume it is, and ask where the dual-point term went.
- Read the limitations section. If there isn’t one, that is your finding.
- Ask what the mission profile was. Then check it resembles your application. An FMEDA computed for 8,000 hours a year at 55 °C says little about a part that will live at 125 °C.
Red flags
- Metrics quoted with no λ_gate source standard, or no mission profile.
- A safe fraction above roughly a third with no structural justification. (That threshold is our rule of thumb, not a number from the standard — but the absence of a structural justification is the finding either way.)
- Diagnostic coverage identical across regions with different mechanisms.
- Generic public SER figures presented as final rather than as placeholders.
- A PMHF quoted with no statement of whether it is residual-only or complete.
- No traceability from coverage claims to evidence.
- No stated distinction between pre-silicon estimate and sign-off.
- A certificate presented as if it covers your use. Third-party assessors do certify SEooC elements, and a vendor holding such a certificate is making a real claim — do not challenge its existence. What the certificate attests is the analysis under the vendor’s declared assumptions. It does not transfer to your item, it does not discharge your integration obligations, and it says nothing about whether their assumed context resembles yours. The red flag is the implication that their certificate makes your element compliant. Ask to see the assumptions the certificate was issued against; that document is the one that matters.
4. What you still have to do yourself
An IP-level FMEDA is an input to your safety case, never a substitute for it. Even a strong one leaves you with real work:
- Validate the SEooC assumptions against your actual system. Every one of them was a guess about you. Where a guess is wrong, the analysis must be redone, not adjusted.
- Re-run the numbers on the integrated netlist. Element counts shift, and integration changes what is genuinely safe.
- Replace the soft-error term with your foundry’s measured SER.
- Compose the metrics upward. Block-level results have to roll into the element and then the item. A collection of passing blocks is not a passing system.
- Address the dependent failures — common-cause and cascading — that a standalone block analysis structurally cannot see.
- Handle the systematic side separately: verification independence, tool confidence, the safety manual’s integration requirements.
The honest summary: a good vendor FMEDA saves you months and gives your assessor a defensible starting point. It does not give you a safety case, and any vendor implying otherwise is selling you a document rather than helping you ship a part.
Glossary
ASIL — Automotive Safety Integrity Level, A (lowest) to D (highest), assigned per hazard from severity, exposure and controllability. It is a property of the hazard, not of the part, which is why an IP block can only ever be offered as suitable for an ASIL — the integrator owns the assignment. It fixes the SPFM, LFM and PMHF targets everything else is measured against.
Diagnostic coverage (DC) — The fraction of faults in a region that a safety mechanism detects. The single most consequential number in an FMEDA and the easiest to claim without evidence: a mechanism’s DC should come from fault injection against real RTL, and it should be proved two-sidedly — break the mechanism deliberately and confirm the number falls back.
FIT — Failures In Time: one failure per device-hours. The unit every failure rate in the analysis is expressed in, derived from a base rate (IEC 62380, SN 29500 or a foundry figure) scaled by the mission profile.
FMEDA — Failure Modes, Effects and Diagnostic Analysis: the quantitative half of a functional-safety argument. It partitions the design into regions, assigns each a failure rate and a failure-mode distribution, credits each safety mechanism with a diagnostic coverage, and computes the metrics. It answers “how much of this is covered”, not “is this designed well” — that is the systematic side.
Latent fault — An undetected fault that causes no hazard on its own but combines with a second, later fault to do so. The classic case is a diagnostic that has silently failed: the system is now unprotected and nothing has indicated it. This is what LFM measures and why safety mechanisms need their own self-tests.
LFM — Latent Fault Metric: coverage of latent multi-point faults. Targets are 60% for ASIL B, 80% for C, 90% for D. In practice it is driven by whether the safety mechanisms are themselves testable — a comparator that cannot be checked is a latent fault waiting to happen.
λ_SR — The safety-related failure rate: the portion of the total failure rate that can affect a safety goal. It is the denominator the metrics are computed against, so how the safe/safety-related split is drawn changes every number downstream, and it deserves more scrutiny than it usually gets.
Mission profile — The assumed operating conditions: hours per year, temperature distribution, lifetime, power cycles. Failure rates are strongly temperature-dependent, so the mission profile is not paperwork — a profile assuming 55 °C where the part runs at 105 °C understates the rate substantially, and it is an assumption of use the integrator must confirm.
PMHF — Probabilistic Metric for random Hardware Failures, per hour: the whole-item probability of a safety-goal violation. Targets are /h for ASIL B and C, /h for D. Unlike SPFM and LFM it is an absolute rate rather than a percentage, so it is the metric that notices when an item is simply too large.
Residual fault — The part of a fault that the safety mechanism fails to catch: the fraction of a dangerous fault. Residual faults are what SPFM counts against you, and they are why a 99% mechanism on a large region can still dominate the budget.
Safe fault — A fault that cannot produce a safety-relevant effect — because it is in unused logic, because it is masked, or because it drives the design to its safe state. Classifying a fault as safe is legitimate when the rule was stated before the number was known, and is metric-gaming when it was not.
SECDED — Single Error Correct, Double Error Detect: a Hamming-derived code that corrects one bit error and detects two. The distinction matters in an FMEDA: a correcting mechanism produces no deviation and no report, so its faults score as safe rather than detected — which looks like an unexercised region unless you know what protects it.
SEooC — Safety Element out of Context: analysed against assumed usage rather than a known system, because the supplier does not know the vehicle. Everything the analysis assumed becomes an assumption of use the integrator must validate, and that list is part of the deliverable.
SER — Soft Error Rate: transient upsets from neutrons and alpha particles, expressed in FIT per megabit or per device. Distinct from permanent failures, and it scales with altitude and with memory content, so a design with large SRAM arrays is dominated by it.
SPFM — Single-Point Fault Metric: coverage of single-point and residual faults. Targets are 90% for ASIL B, 97% for C, 99% for D. The metric most often quoted, and the one most sensitive to how the safe fraction was drawn.
Systematic fault — A design or process mistake: a specification error, a coding error, a tool misuse. Not addressed by any of these metrics, which count random hardware failures only. Systematic faults are handled by process — reviews, verification, tool confidence — and a perfect FMEDA says nothing about them.
Run the arithmetic yourself
The calculations in this post are on the site as free browser tools — no sign-up, nothing stored:
- FIT and PMHF calculator — failure-rate budget to PMHF
- FMEDA roll-up calculator — regions to SPFM, LFM and PMHF, including the dual-point pair term
- ASIL determination calculator — severity, exposure and controllability to an ASIL
- Board FIT calculator — a board-level failure-rate roll-up from a BOM
- FMEA action priority — the AIAG-VDA-style precedence rule
The full set is at circuit-design.space/tools.
Further reading
Book links below are Amazon affiliate links: if you buy through one we earn a small commission at no extra cost to you. It does not influence what is recommended — the same books were on this list before the links were.
- ISO 26262:2018 — particularly Part 5 (hardware development, where the metric targets live) and Part 11 (semiconductors). The standard is the authority, and there is no substitute for reading the parts that apply to you.
- IEC 62380 and SN 29500 — the base failure-rate handbooks the FIT numbers come from. Dry, and worth knowing which one a vendor’s figures were taken from, because they disagree.
- David Smith and Kenneth Simpson, The Safety Critical Systems Handbook — IEC 61508 rather than ISO 26262, and the clearest published explanation of where these metrics come from and what they assume.
- Nancy Leveson, Engineering a Safer World — the argument that component failure rates are not the whole of safety. Read it as a corrective to everything above, because an FMEDA counts random hardware failures and says nothing about the systematic ones.
- Erik Seligman, Tom Schubert and M V Achutha Kiran Kumar, Formal Verification: An Essential Toolkit for Modern VLSI Design — for the safety mechanisms whose coverage claims have to be proved rather than asserted.
Related reading
- From Concept to Tapeout: The ASIC Design Flow, Step by Step
- Process Geometry: What a Chip “Node” Really Means
- From Concept to Board: The PCB Design Flow, Step by Step
- Power Integrity: From Static IR Drop to Rapid di/dt — where electromigration and capacitor wear-out become quantitative reliability inputs rather than footnotes
We ship the FMEDA in the box. Every block in the safety soft-IP catalog carries a per-IP FMEDA report with the structure described above — provenance, fault-region partition, traceability from every coverage claim to its evidence, and a limitations section that says plainly what is engineering-grade and what needs your foundry’s numbers before sign-off.
If you are scoping a safety program and want to see what arrives, the flyer for any block is public and the full work package is available under NDA — get in touch.
circuit-design.space · +1-971-357-1400 · anovickis@circuit-design.space